




8.3times
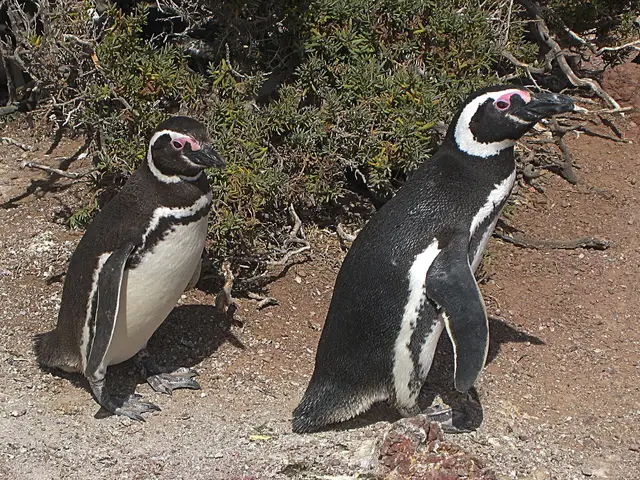
In Puerto Madryn, September gets 8.3 times more travelers than May. It is the destination with the sharpest season: outside the peak, you will have far more room to enjoy it.
Free from any phone, anywhere in the country.
If you lose your passport, report it to the police and to your consulate. Source: argentina.gob.ar
From La Quiaca to Ushuaia · 110 destinations
Every month, somewhere in the country is at its best. Find out where, with official data on how many travelers arrive at each destination, month by month.
Official alerts right now Checking…
Information from Argentina’s National Weather Service (SMN), National Water Institute (INA, rivers), Volcano Observatory (OAVV) and GDACS (UN and European Commission). Alerts are issued in Spanish. Before you travel, check with local authorities and Civil Defense (103).
The map
Each dot is a place measured by INDEC, Argentina’s official statistics agency. Pick a month: earth-colored places are in peak season, ochre ones in shoulder season, and teal ones are quiet. Diamonds are attractions without measurements.
Pick a month
Dots: how busy each place is that month
Each place is compared with its own busiest month. Dot size shows how many travelers it gets in a year.
A province outline: alerts
The province has an active official alert from the National Weather Service. The color is the alert level.
Provinces
Tap a province to see all its places, the best time to go, the weather and help numbers.
The calendar
Each row is a destination, from north to south. Darker squares are the months with more travelers; the dot marks the three quietest months, ideal if you want more space.
| Destination | Jan | Feb | Mar | Apr | May | Jun | Jul | Aug | Sep | Oct | Nov | Dec |
|---|---|---|---|---|---|---|---|---|---|---|---|---|
| Purmamarca and the Quebrada 23°45′ S · data: Quebrada de Humahuaca | January: 15,640 travelers | February: 15,494 travelers | March: 15,875 travelers | April: 15,599 travelers | May: 12,443 travelers | June: 11,733 travelers | July: 26,301 travelers | August: 14,115 travelers | September: 15,986 travelers | October: 16,064 travelers | November: 12,927 travelers | December: no data |
| Puerto Iguazú 25°36′ S | January: 64,721 travelers | February: 61,554 travelers | March: 64,497 travelers | April: 59,754 travelers | May: 50,663 travelers | June: 43,923 travelers | July: 62,854 travelers | August: 52,426 travelers | September: 55,048 travelers | October: 60,789 travelers | November: 63,684 travelers | December: no data |
| Cafayate 26°04′ S | January: 11,456 travelers | February: 12,833 travelers | March: 9,358 travelers | April: 9,908 travelers | May: 8,650 travelers | June: 7,366 travelers | July: 18,054 travelers | August: 8,993 travelers | September: 9,275 travelers | October: 11,978 travelers | November: 11,230 travelers | December: no data |
| Mendoza 32°53′ S | January: 45,325 travelers | February: 42,595 travelers | March: 49,303 travelers | April: 42,136 travelers | May: 41,886 travelers | June: 36,582 travelers | July: 54,392 travelers | August: 40,455 travelers | September: 41,371 travelers | October: 47,133 travelers | November: 47,753 travelers | December: no data |
| Mar del Plata 38°00′ S | January: 182,570 travelers | February: 144,722 travelers | March: 97,567 travelers | April: 67,744 travelers | May: 44,305 travelers | June: 46,608 travelers | July: 58,679 travelers | August: 50,730 travelers | September: 61,675 travelers | October: 78,773 travelers | November: 103,871 travelers | December: no data |
| San Martín de los Andes 40°09′ S | January: 27,519 travelers | February: 19,764 travelers | March: 13,482 travelers | April: 9,879 travelers | May: 5,223 travelers | June: 5,924 travelers | July: 15,693 travelers | August: 11,592 travelers | September: 7,879 travelers | October: 9,766 travelers | November: 14,264 travelers | December: no data |
| San Carlos de Bariloche 41°08′ S | January: 97,604 travelers | February: 77,620 travelers | March: 54,849 travelers | April: 40,315 travelers | May: 28,777 travelers | June: 41,147 travelers | July: 76,581 travelers | August: 72,536 travelers | September: 64,347 travelers | October: 55,989 travelers | November: 48,505 travelers | December: no data |
| Puerto Madryn 42°46′ S | January: 15,600 travelers | February: 13,439 travelers | March: 7,443 travelers | April: 5,406 travelers | May: 3,056 travelers | June: 3,924 travelers | July: 7,933 travelers | August: 10,222 travelers | September: 25,515 travelers | October: 23,860 travelers | November: 18,956 travelers | December: no data |
| El Chaltén 49°20′ S | Not measured by INDEC | |||||||||||
| El Calafate 50°20′ S | January: 56,109 travelers | February: 51,490 travelers | March: 49,904 travelers | April: 28,054 travelers | May: 9,673 travelers | June: 11,022 travelers | July: 15,291 travelers | August: 14,794 travelers | September: 21,349 travelers | October: 40,658 travelers | November: 50,379 travelers | December: no data |
| Ushuaia 54°48′ S | January: 41,901 travelers | February: 34,740 travelers | March: 34,462 travelers | April: 27,552 travelers | May: 13,935 travelers | June: 16,150 travelers | July: 27,907 travelers | August: 29,693 travelers | September: 28,085 travelers | October: 26,633 travelers | November: 45,653 travelers | December: no data |
What the numbers say
8.3times
In Puerto Madryn, September gets 8.3 times more travelers than May. It is the destination with the sharpest season: outside the peak, you will have far more room to enjoy it.
68%
Puerto Iguazú is lovely all year: its quietest month still gets 68% of the travelers of its busiest month.
5of 10
January is the busiest month in 5 of the 10 destinations measured. In another 3, the peak comes in July, with the Argentine winter holidays.
Destinations
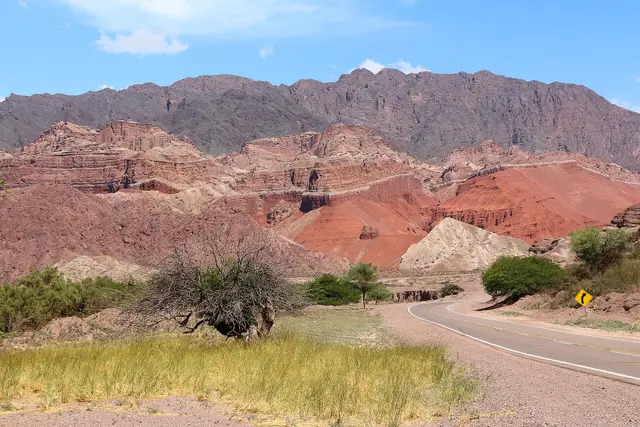
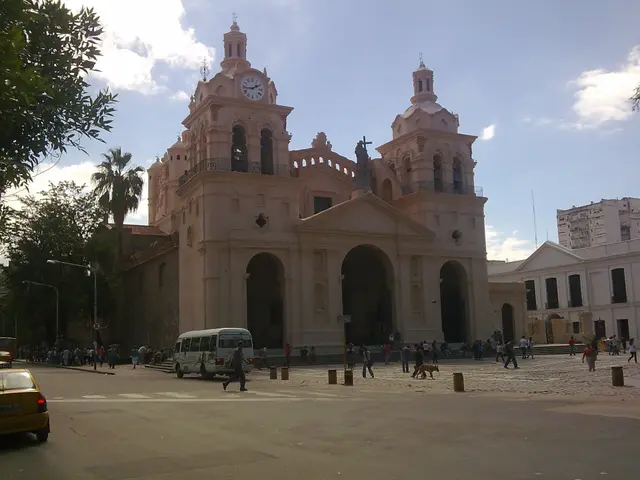
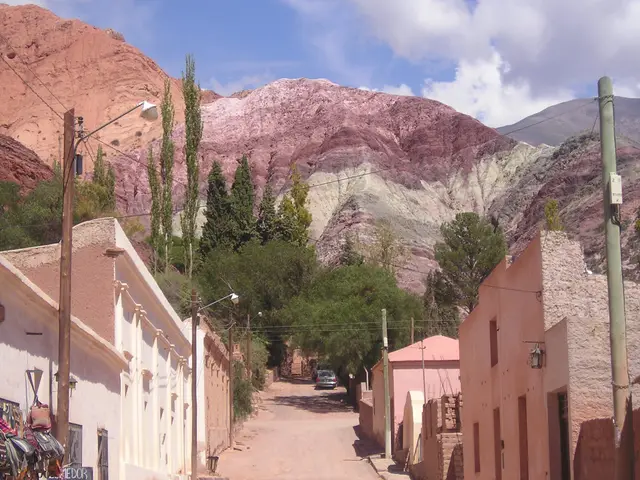
Colorful canyons, adobe villages and high-altitude wine.
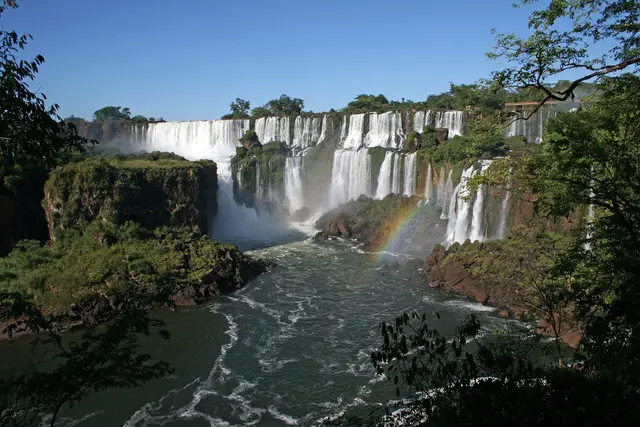
Rainforest, huge rivers and falling water.
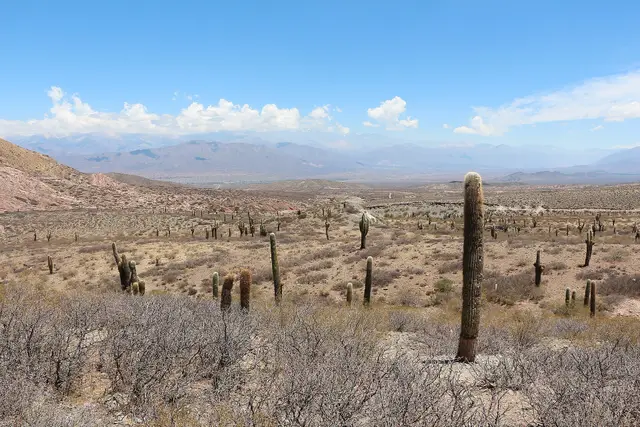
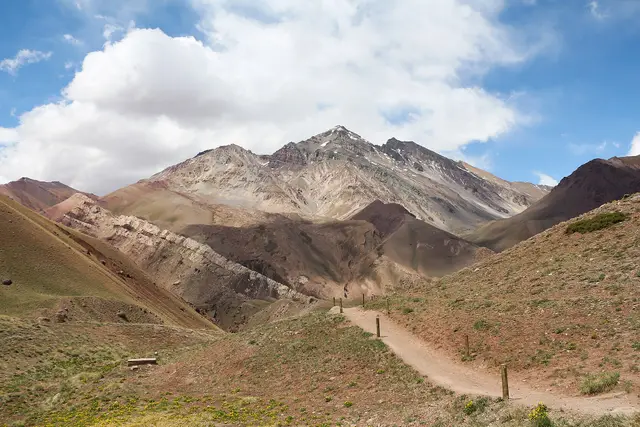
Vineyards watered by snowmelt, and the highest Andes.
 31°32′ S
San Juan
Sun, wine and Sarmiento's home
Quietest in January, February and March
 32°53′ S
Mendoza
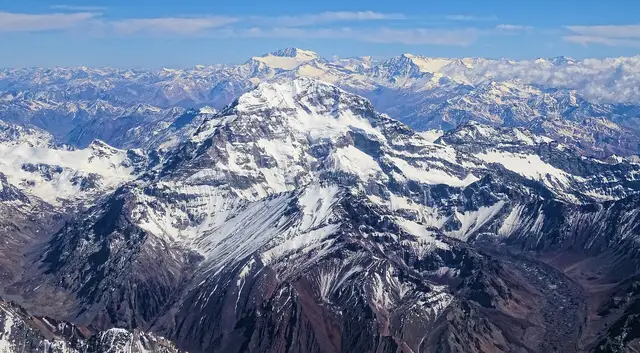
Wine at the foot of the roof of the Americas
Quietest in June, August and September
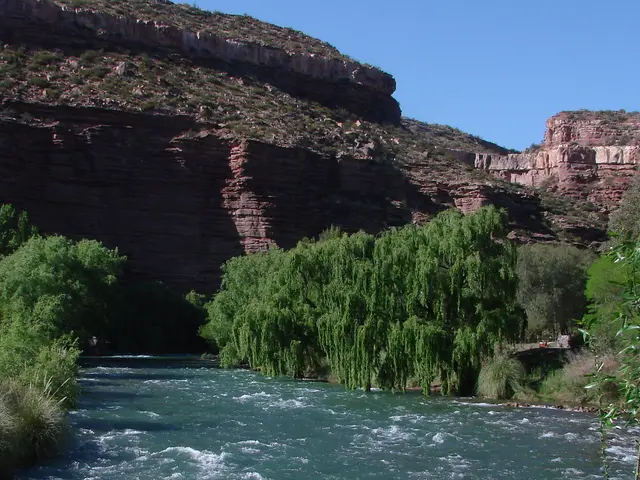 34°37′ S
Mendoza
Canyon, reservoirs and rafting
Quietest in May, June and September
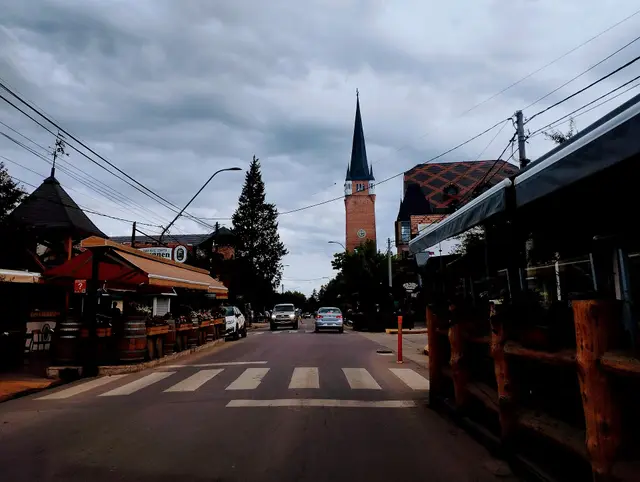
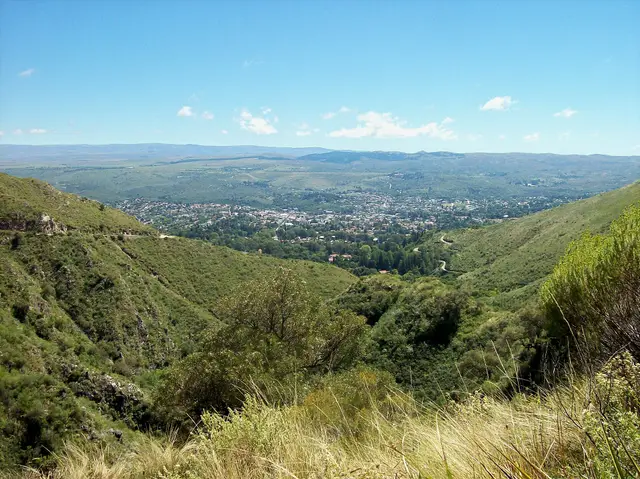
Hills, mountain rivers and summer towns.
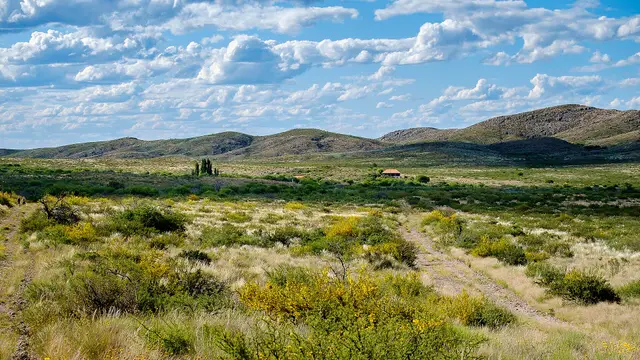
Open sea and beach towns.
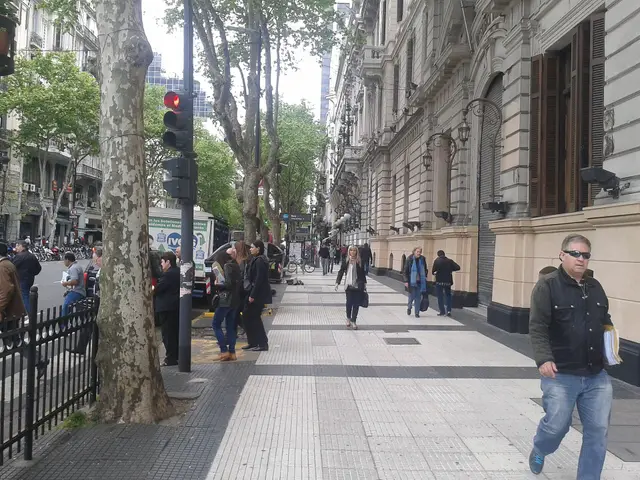 34°36′ S
Ciudad de Buenos Aires
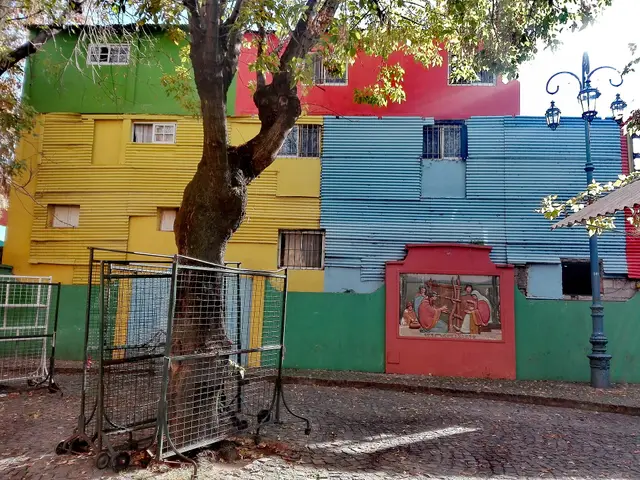
The city that never sleeps
Quietest in February, May and June
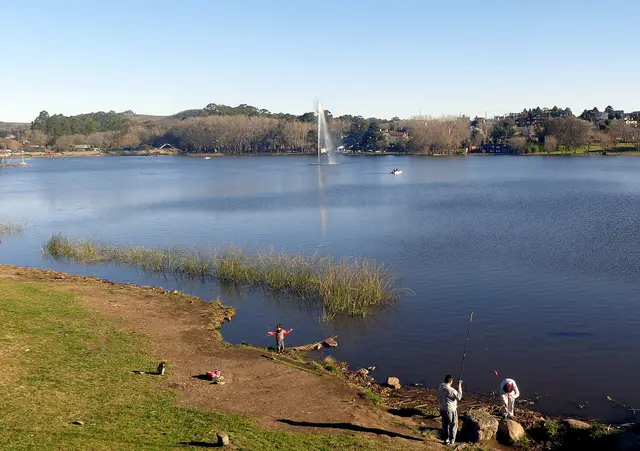 37°19′ S
Buenos Aires
Hills, cheeses and the Rocking Stone
Quietest in January, February and October
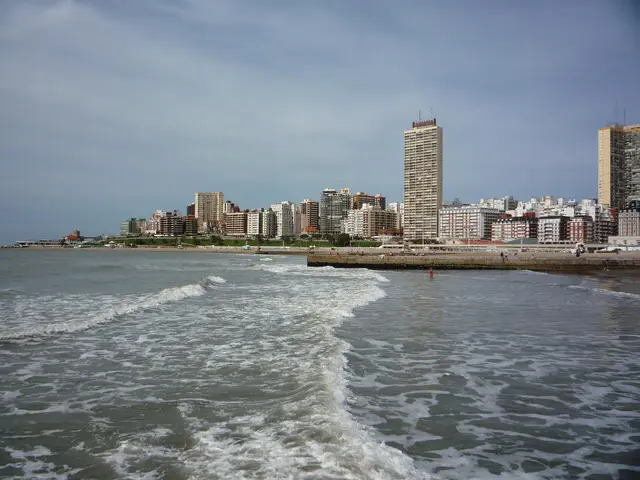 38°00′ S
Buenos Aires
La Feliz, with the sea all year round
Quietest in May, June and August
Lakes, glaciers, whales and the end of the world.
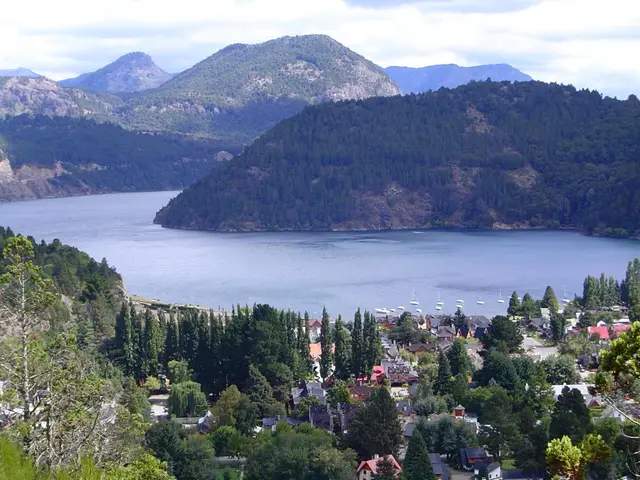 40°09′ S
Neuquén
Where the Seven Lakes begin
Quietest in May, June and September
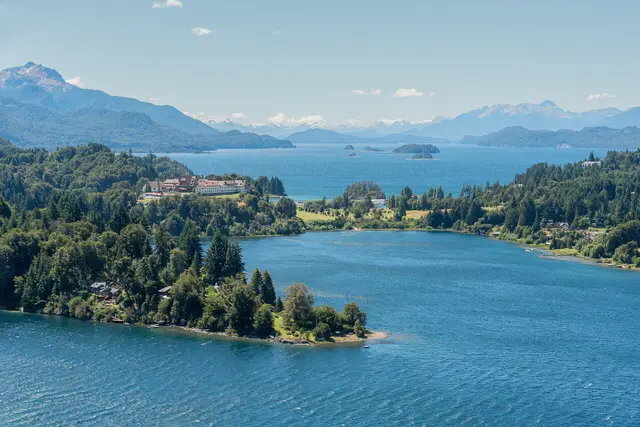 41°08′ S
Río Negro
Lakes, forests and snow
Quietest in April, May and June
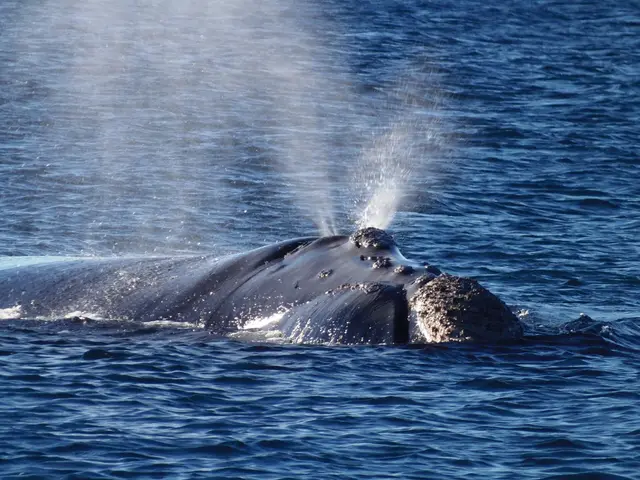 42°46′ S
Chubut
Whales from the shore
Quietest in April, May and June
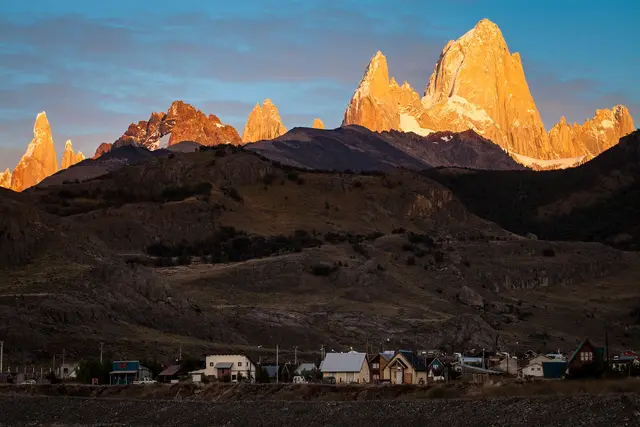 49°20′ S
Santa Cruz
Argentina’s trekking capital
Not measured by INDEC
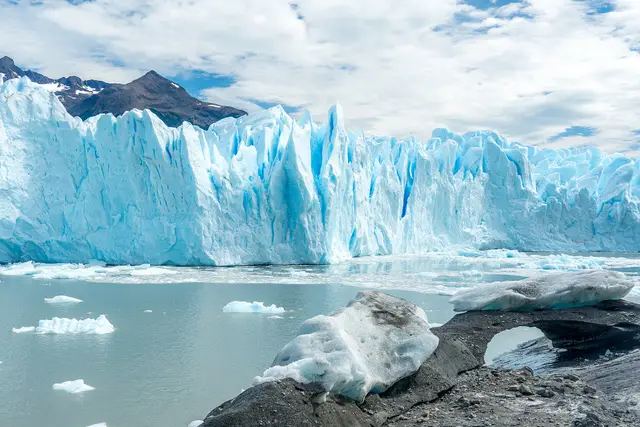 50°20′ S
Santa Cruz
A glacier you can hear
Quietest in May, June and August
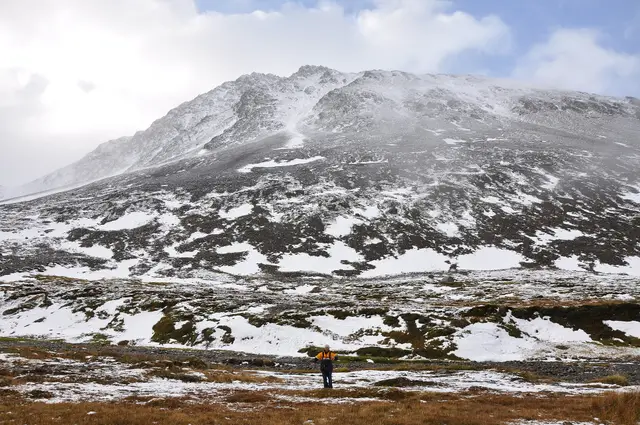 54°48′ S
Tierra del Fuego
The city at the end of the world
Quietest in May, June and October
Sources
Traveler numbers come from the Hotel Occupancy Survey (EOH) run by INDEC, Argentina’s national statistics agency, together with the Tourism Secretariat. It covers hotels and similar lodging in the main tourist towns; it does not include campsites, vacation rentals or people staying with friends. So it is best read as a gauge of when places are busiest, not as a total visitor count. Averages, percentages of each place’s busiest month and the seasons are our own calculations based on that data.
Purmamarca uses data for the whole Quebrada de Humahuaca, which INDEC measures as a single area. El Chaltén has no measurements of its own; it is here anyway, because it is worth the trip. Months that INDEC estimates with a margin of error above 20% are marked with an asterisk.
Photos are from Wikimedia Commons and are used under each author’s license, shown below each image.